



slosizer sizes reserved LLM capacity against throughput, latency SLOs, and an explicit economic objective.
It takes request traces, converts them into provider-specific capacity work, simulates queueing under bursty arrivals, and tells you how many reserved units you should buy plus how much slack capacity you are likely to carry.
The package is built for the extremely normal situation where:
- you know your request shape better than your vendor calculator does,
- you care about p95 or p99 latency, not just average throughput,
- and you do not want your capacity plan to be a sacred spreadsheet that nobody trusts.
Reserved-capacity systems like GSU/PTU are fundamentally throughput constructs, but production teams usually care about latency SLOs, burst risk, and headroom.
slosizer gives you one place to:
- load request logs into the format the planner expects,
- convert requests into provider-specific capacity units (GSU/PTU),
- plan capacity for either:
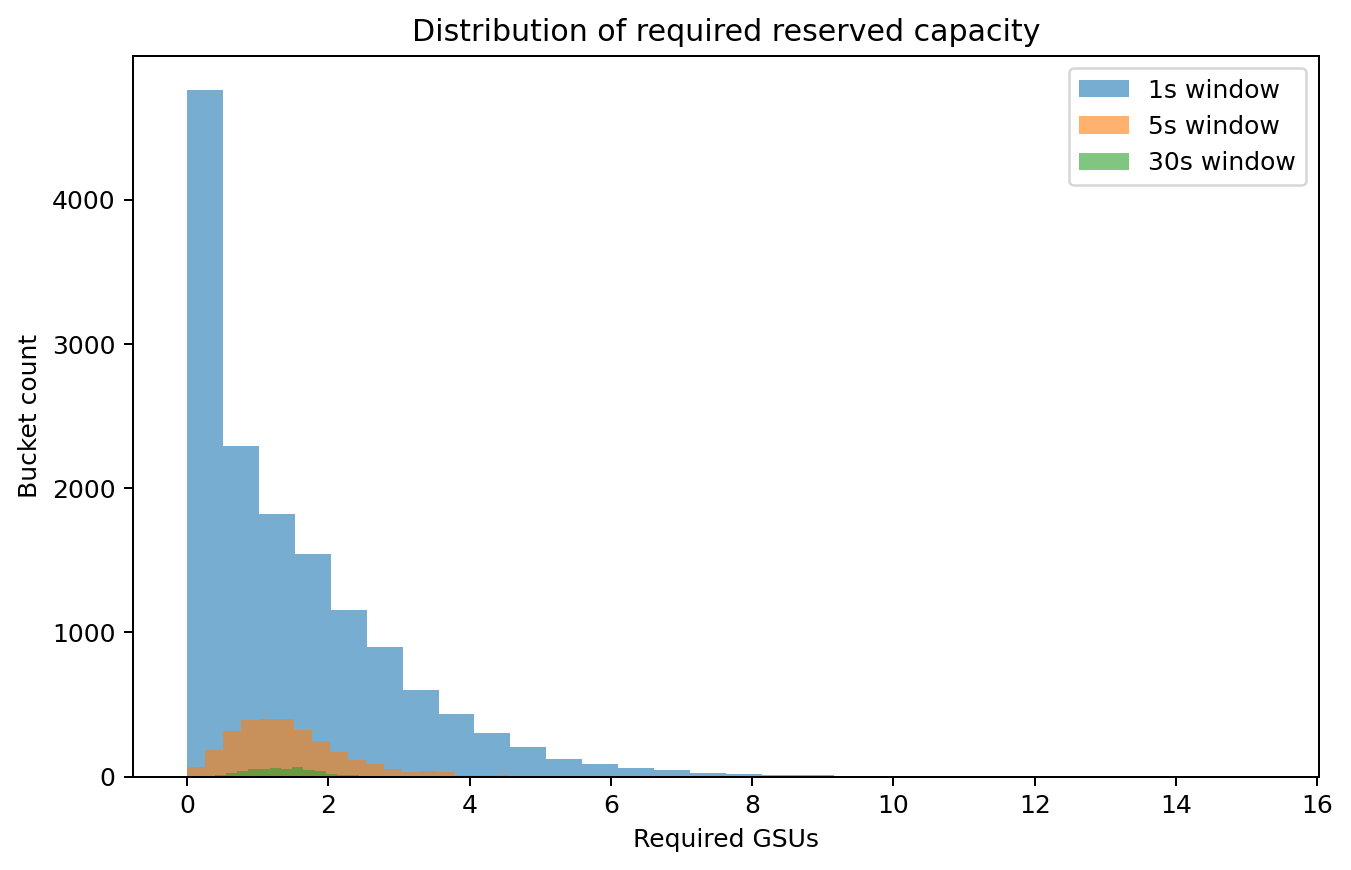
- throughput: control overload probability or required-unit percentile,
- latency: satisfy p95/p99 queue-aware latency targets,
- hybrid: balance provisioned cost against paygo overflow,
- profit: maximize expected gross value after provisioned and SLO-failure costs,
- quantify:
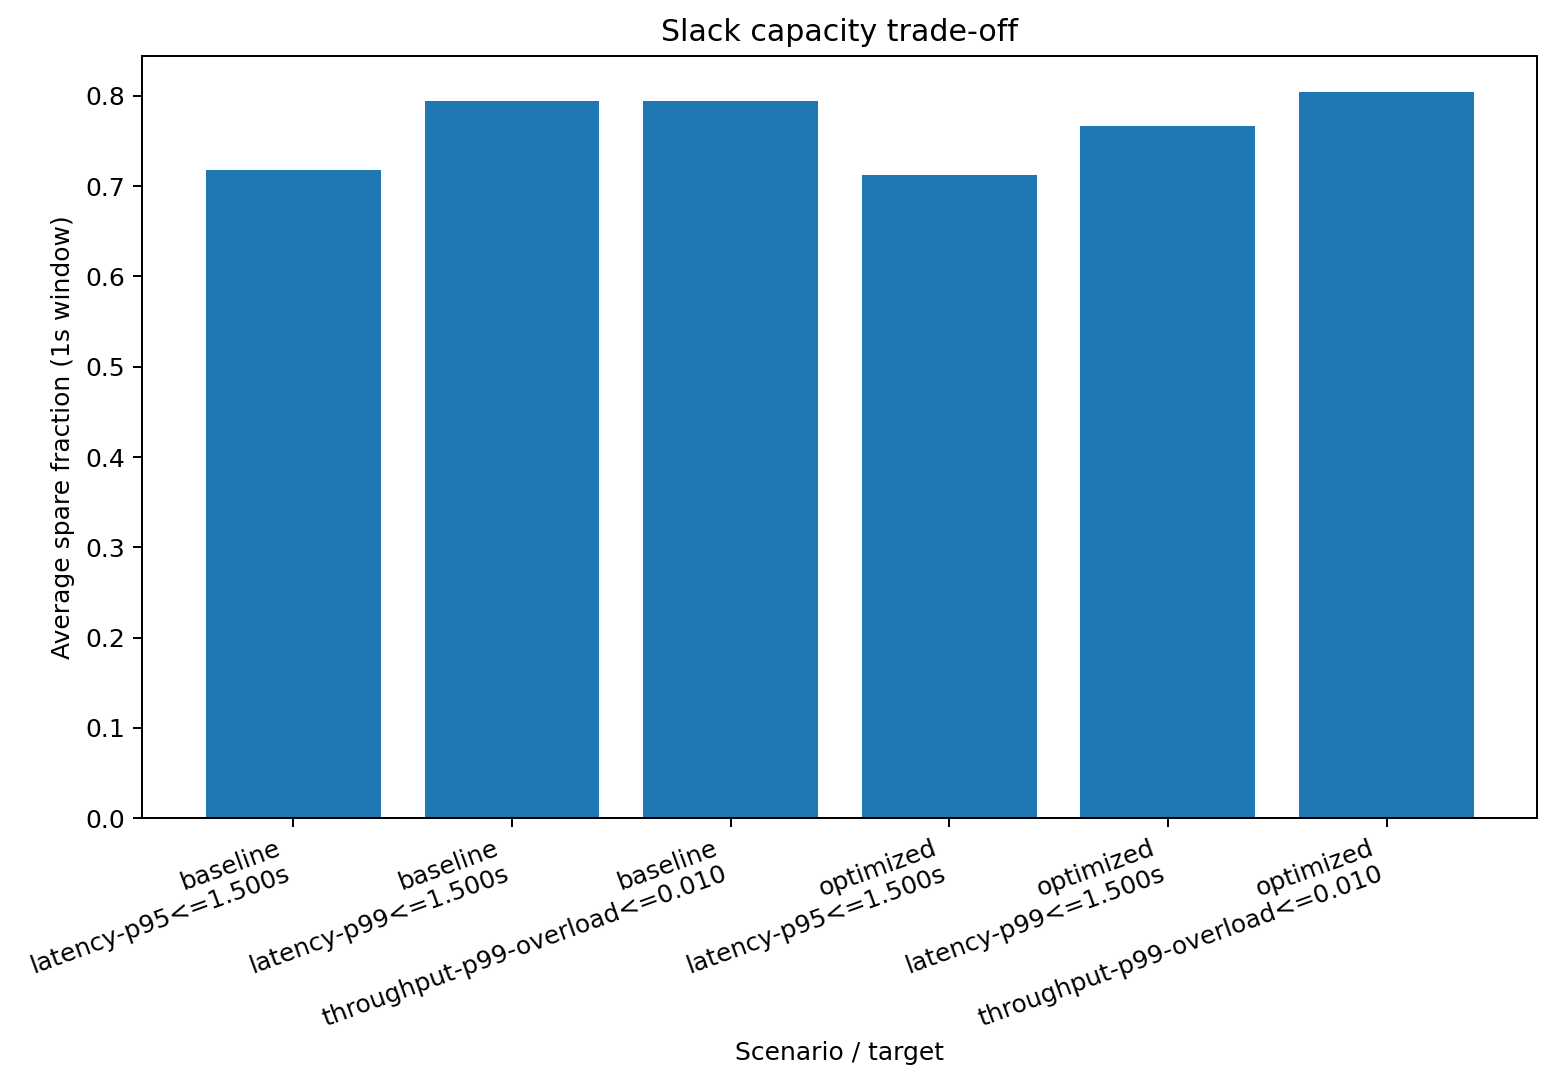
- spare capacity,
- overload probability,
- expected overflow,
- optimization benefit.
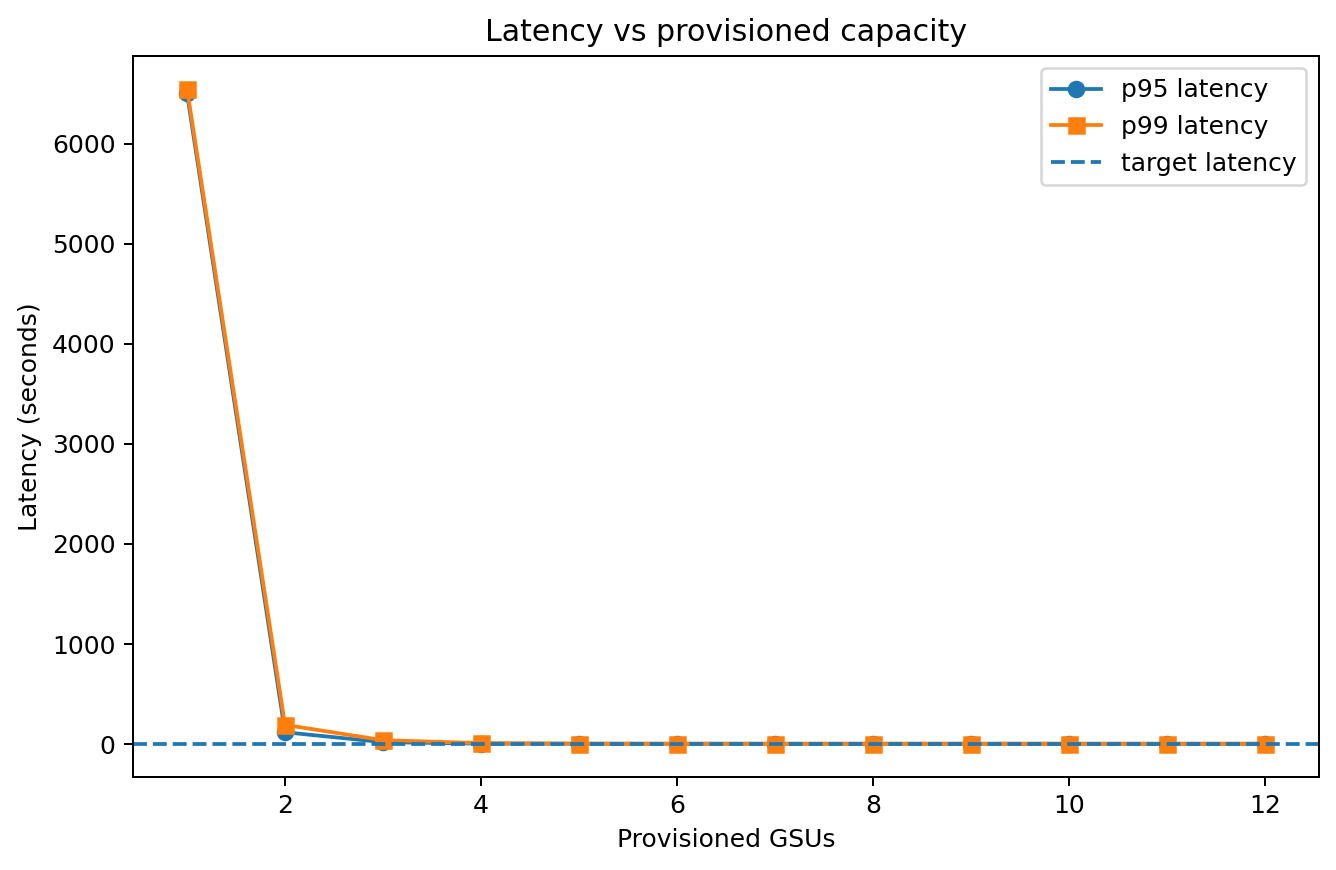
Total latency = model latency + queue delay.
Model latency is how long the LLM takes to process your request with no contention, estimated from token counts and provider throughput rates. Queue delay is waiting time caused by bursty arrivals: when requests arrive faster than capacity can serve them, a backlog forms.
The package simulates an FCFS queue against your request trace to estimate tail latencies (p95/p99). More reserved capacity = shorter queues = lower tail latency. The goal is finding the minimum capacity that keeps queue delay acceptable.
Use the synthetic generator to explore capacity planning before you have real logs:
import slosizer as slz

trace = slz.make_synthetic_trace(seed=42)
profile = slz.vertex_profile("gemini-2.5-flash-lite")

result = slz.plan_capacity(
    trace,
    profile,
    slz.LatencyTarget(slz.LatencySLO(threshold_s=1.5, percentile=0.99, metric="e2e")),
)You need a typed Parquet table (or DataFrame) with at minimum these 3 columns:
| Column | What it means |
|---|---|
timestamp |
When the request arrived (datetime or seconds) |
input_tokens |
Tokens in the prompt |
output_tokens |
Tokens in the response |
That's it. The package normalizes timestamps and fills defaults for everything else.
import pandas as pd
import slosizer as slz

df = pd.read_parquet("requests.parquet")

trace = slz.from_dataframe(
    df,
    schema=slz.RequestSchema(
        time_col="timestamp",
        input_tokens_col="input_tokens",
        output_tokens_col="output_tokens",
    ),
    provider="vertex",
    model="gemini-2.5-flash-lite",
)uv sync --all-groupsuv run python examples/quickstart.pyThis writes:
examples/output/comparison.parquetexamples/output/latency_vs_capacity.pngexamples/output/required_units_distribution.pngexamples/output/scenario_benefit.pngexamples/output/percentile_tradeoff.png
uv run pytest -q
uv run ruff check src tests examples
uv run ruff format --check src tests examples
uv run deptry .
uv run vultureimport pandas as pd
import slosizer as slz
df = pd.read_parquet("requests.parquet")
trace = slz.from_dataframe(
df,
schema=slz.RequestSchema(
time_col="timestamp",
class_col="route",
input_tokens_col="prompt_tokens",
cached_input_tokens_col="cached_prompt_tokens",
output_tokens_col="completion_tokens",
thinking_tokens_col="reasoning_tokens",
max_output_tokens_col="max_output_tokens",
latency_col="latency_s",
),
provider="vertex",
model="gemini-2.5-flash-lite",
)
profile = slz.vertex_profile("gemini-2.5-flash-lite")
result = slz.plan_capacity(
trace,
profile,
slz.LatencyTarget(
slz.LatencySLO(
threshold_s=1.5,
percentile=0.99,
metric="e2e",
)
),
)
print(result.recommended_units)
print(result.metrics)import slosizer as slz
trace = slz.make_synthetic_trace(seed=42)
profile = slz.vertex_profile("gemini-2.5-flash-lite")
result = slz.plan_capacity(
trace,
profile,
slz.ThroughputTarget(
percentile=0.99,
max_overload_probability=0.01,
windows_s=(1.0, 5.0, 30.0),
),
)
print(result.recommended_units)
print(result.slack_summary)This is the normal operating case. The request trace is the demand forecast. With fixed demand and a hard SLO, minimizing inference cost subject to the SLO maximizes profit. Users do not need to estimate request value or demand elasticity.
from datetime import date

import slosizer as slz

trace = slz.make_synthetic_trace(seed=42)
profile = slz.vertex_profile("gemini-2.5-flash")
pricing = slz.RateCard(
    provisioned=slz.ProvisionedPricing(cost_per_unit_hour=3.698630137),
    paygo=slz.PaygoPricing(
        input_cost_per_million=0.30,
        cached_input_cost_per_million=0.03,
        output_cost_per_million=2.50,
        thinking_cost_per_million=2.50,
    ),
    currency="USD",
    provider="vertex",
    model="gemini-2.5-flash",
    verified_on=date(2026, 8, 15),
    source="https://cloud.google.com/vertex-ai/generative-ai/pricing",
)

result = slz.plan_hybrid_capacity(
    trace,
    profile,
    pricing,
    slz.HybridTarget(
        strategy="cost_optimal",
        latency_slo=slz.LatencySLO(
            threshold_s=1.5,
            percentile=0.99,
        ),
    ),
    options=slz.PlanOptions(baseline_latency_model=slz.BaselineLatencyModel()),
)

print(f"Provision {result.provisioned_units} GSUs + paygo overflow")
print(
    f"Saves ${result.savings_vs_full_provision:.2f}/hr ({result.savings_percent:.0f}%)"
)
That public list rate was checked on 2026-08-15. Production analysis should use the effective rate on your invoice or contract and record its source and validity dates.
cost_optimal finds the cheapest provisioned and paygo blend. percentile_split provisions at a chosen workload percentile and sends the rest to paygo.
Use plan_profit_capacity() when you need an absolute profit estimate or want to price SLO misses instead of treating the SLO as a hard constraint. This requires expected gross value per request and, for a priced SLO, a defensible cost per miss.
import slosizer as slz

trace = slz.make_synthetic_trace(seed=42)
profile = slz.vertex_profile("gemini-2.5-flash")
pricing = slz.RateCard(
    provisioned=slz.ProvisionedPricing(cost_per_unit_hour=3.698630137),
    provider="vertex",
    model="gemini-2.5-flash",
)

result = slz.plan_profit_capacity(
    trace,
    profile,
    pricing,
    slz.ProfitTarget(
        latency_slo=slz.LatencySLO(threshold_s=1.5, percentile=0.99),
        slo_policy="priced",
        value_per_request=0.05,
        slo_violation_cost_per_request=0.01,
    ),
    options=slz.PlanOptions(baseline_latency_model=slz.BaselineLatencyModel()),
)

print(result.expected_profit_hourly)
print(result.candidate_plans)
business_value is gross contribution before inference and SLO costs. It changes the value assigned to a request, not demand. The package does not estimate demand effects. If a model is expected to receive different traffic, supply a different forecast trace in an optional ProfitScenario. Most users should not need this API.
With one trace and a hard SLO, business value changes reported profit but not recommended capacity. Use the hybrid planner for that case.
headroom_factor is rejected for cost_optimal because adding capacity after the search would no longer be cost optimal. Model uncertainty with workload scenarios instead.
Azure support is calibration-first: you seed a profile from the Azure calculator and benchmark results, then use the same planning machinery.
import slosizer as slz

profile = slz.azure_profile(
    "gpt-5.2",
    throughput_per_unit=3400 / 60,
    purchase_increment=5,
    min_units=15,
    input_weight=1.0,
    cached_input_weight=0.0,
    output_weight=8.0,
    thinking_weight=8.0,
    deployment_type="data_zone_provisioned",
)The 3-column minimum works, but you get more accurate capacity estimates with:
| Column | Why it helps |
|---|---|
cached_input_tokens |
Cached tokens cost less capacity |
thinking_tokens |
Reasoning models use extra tokens |
max_output_tokens |
Helps estimate worst-case latency |
class_name |
Separate capacity needs by request type |
latency_s |
Calibrate model latency estimates |
request_model / response_model |
Distinguish the requested alias from the model that actually served |
service_tier |
Separate provisioned, standard, priority, batch, and other routes |
business_value |
Optional absolute-profit or priced-SLO analysis |
See docs/data-requirements.md for full details.
Example input files:
examples/input/synthetic_request_trace_baseline.parquetexamples/input/synthetic_request_trace_optimized.parquet
The package ships a reviewed, versioned TOML catalog for text-capable Vertex
Provisioned Throughput models. Call available_vertex_profiles() for the
current set; this avoids duplicating a model list in documentation. Provider
facts live in src/slosizer/data/vertex.toml, not in optimizer code. Add a new
model by updating the catalog or load your own with load_capacity_profiles().
Azure PTU support is user-calibrated on purpose. The package gives you the same planning engine, but you provide the model-specific PTU profile from your calculator + benchmark loop.
See docs/provider-adapters.md.
The repo ships with a fake but bursty workload containing three classes:
- chat
- rag
- reasoning
The optimized variant simulates:
- tighter prompts,
- more caching,
- shorter outputs,
- lower thinking-token budgets.
That lets you inspect two things immediately:
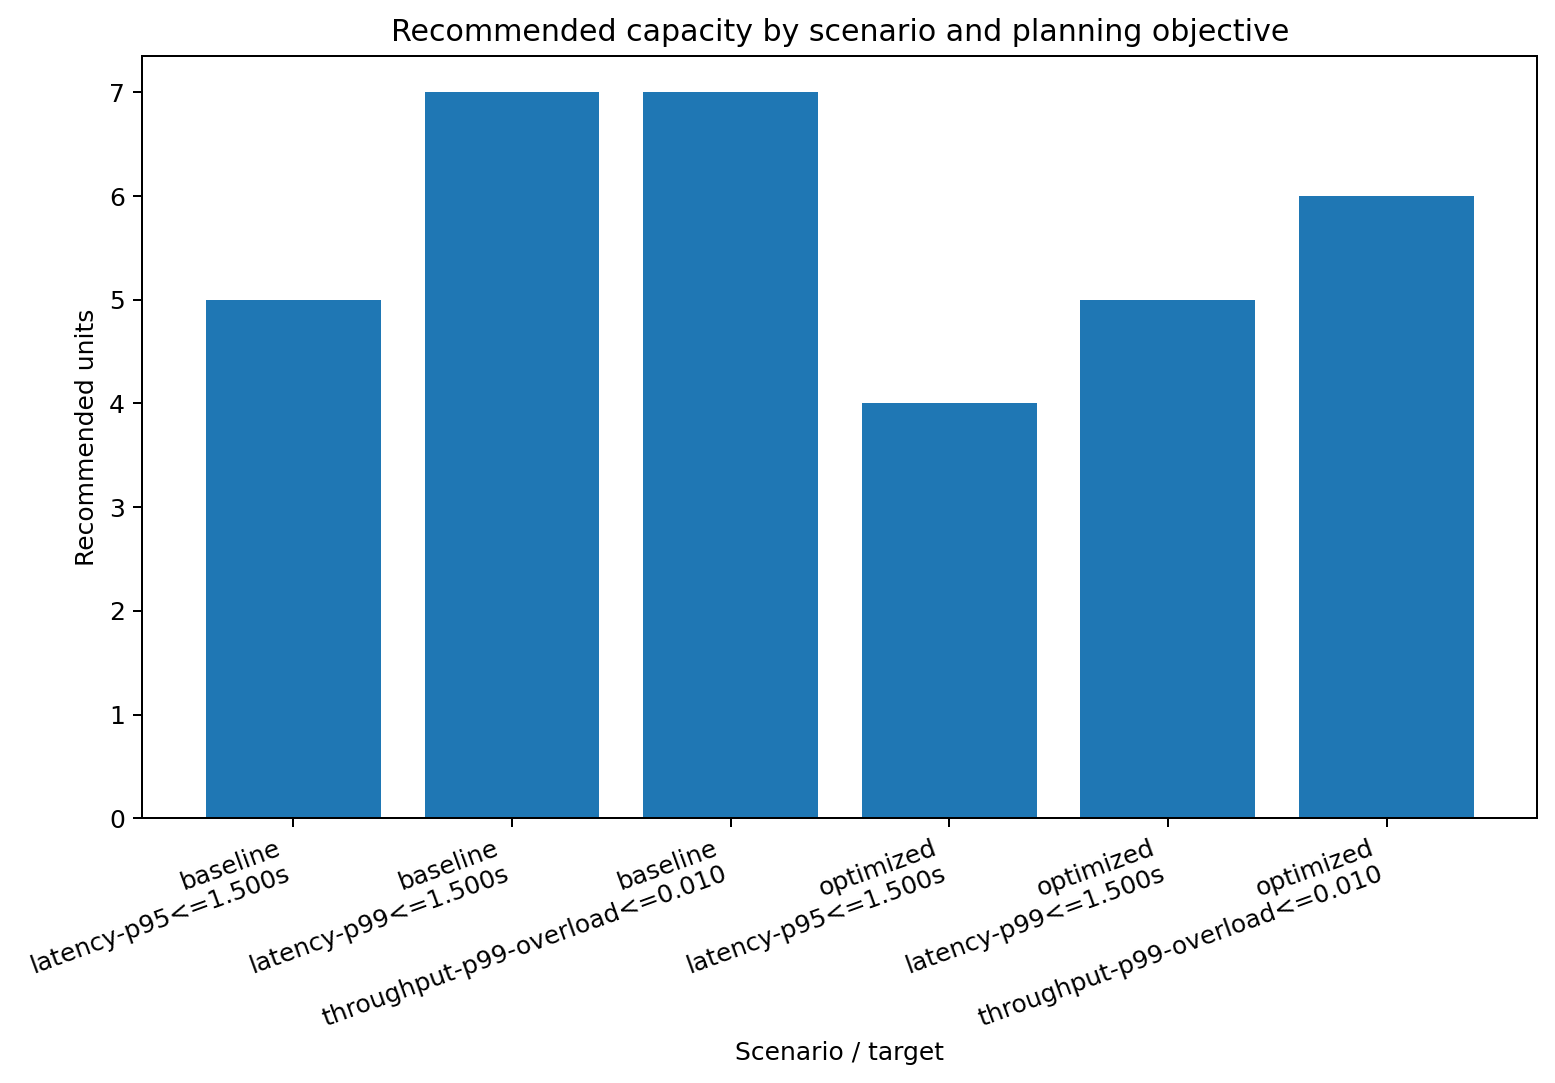
- Optimization can reduce reserved-capacity needs.
- Planning for stricter percentiles usually increases slack capacity.
The demo writes the complete current result table to
examples/output/comparison.parquet and prints the same values to the terminal.
That generated table is the result source; the documentation does not maintain
a second copy of the numbers.
These numbers are synthetic. They are there to show the mechanics, not to cosplay as your production traffic.
Latency vs provisioned capacity
Distribution of required reserved units
Optimization benefit
Slack trade-off
docs/formalization.md: generic throughput/latency modeldocs/economics-and-data.md: profit objective, SLO policy, and storage boundariesdocs/data-requirements.md: what columns you need and whydocs/provider-adapters.md: how GSU/PTU adaptation worksdocs/examples.md: the synthetic walkthroughexamples/quickstart.py: reproducible demo script
- The queue model is intentionally simple: FCFS fluid queueing, not a perfect service simulator.
- Built-in Vertex profiles are text-centric. Multimodal traffic needs more columns and weights.
- Azure PTU math is workload-sensitive, so the package does not fake vendor-authoritative PTU values for you.
- If you do not have a latency column, the package falls back to a simple token-based baseline latency model. That is a starting point, not gospel.
The package name is slosizer because "how many units do I need, and how much empty air am I buying to hit p99?" is the real question under all the vendor jargon.