Web GUI to inspect Valgrind and Xdebug profiling reports.
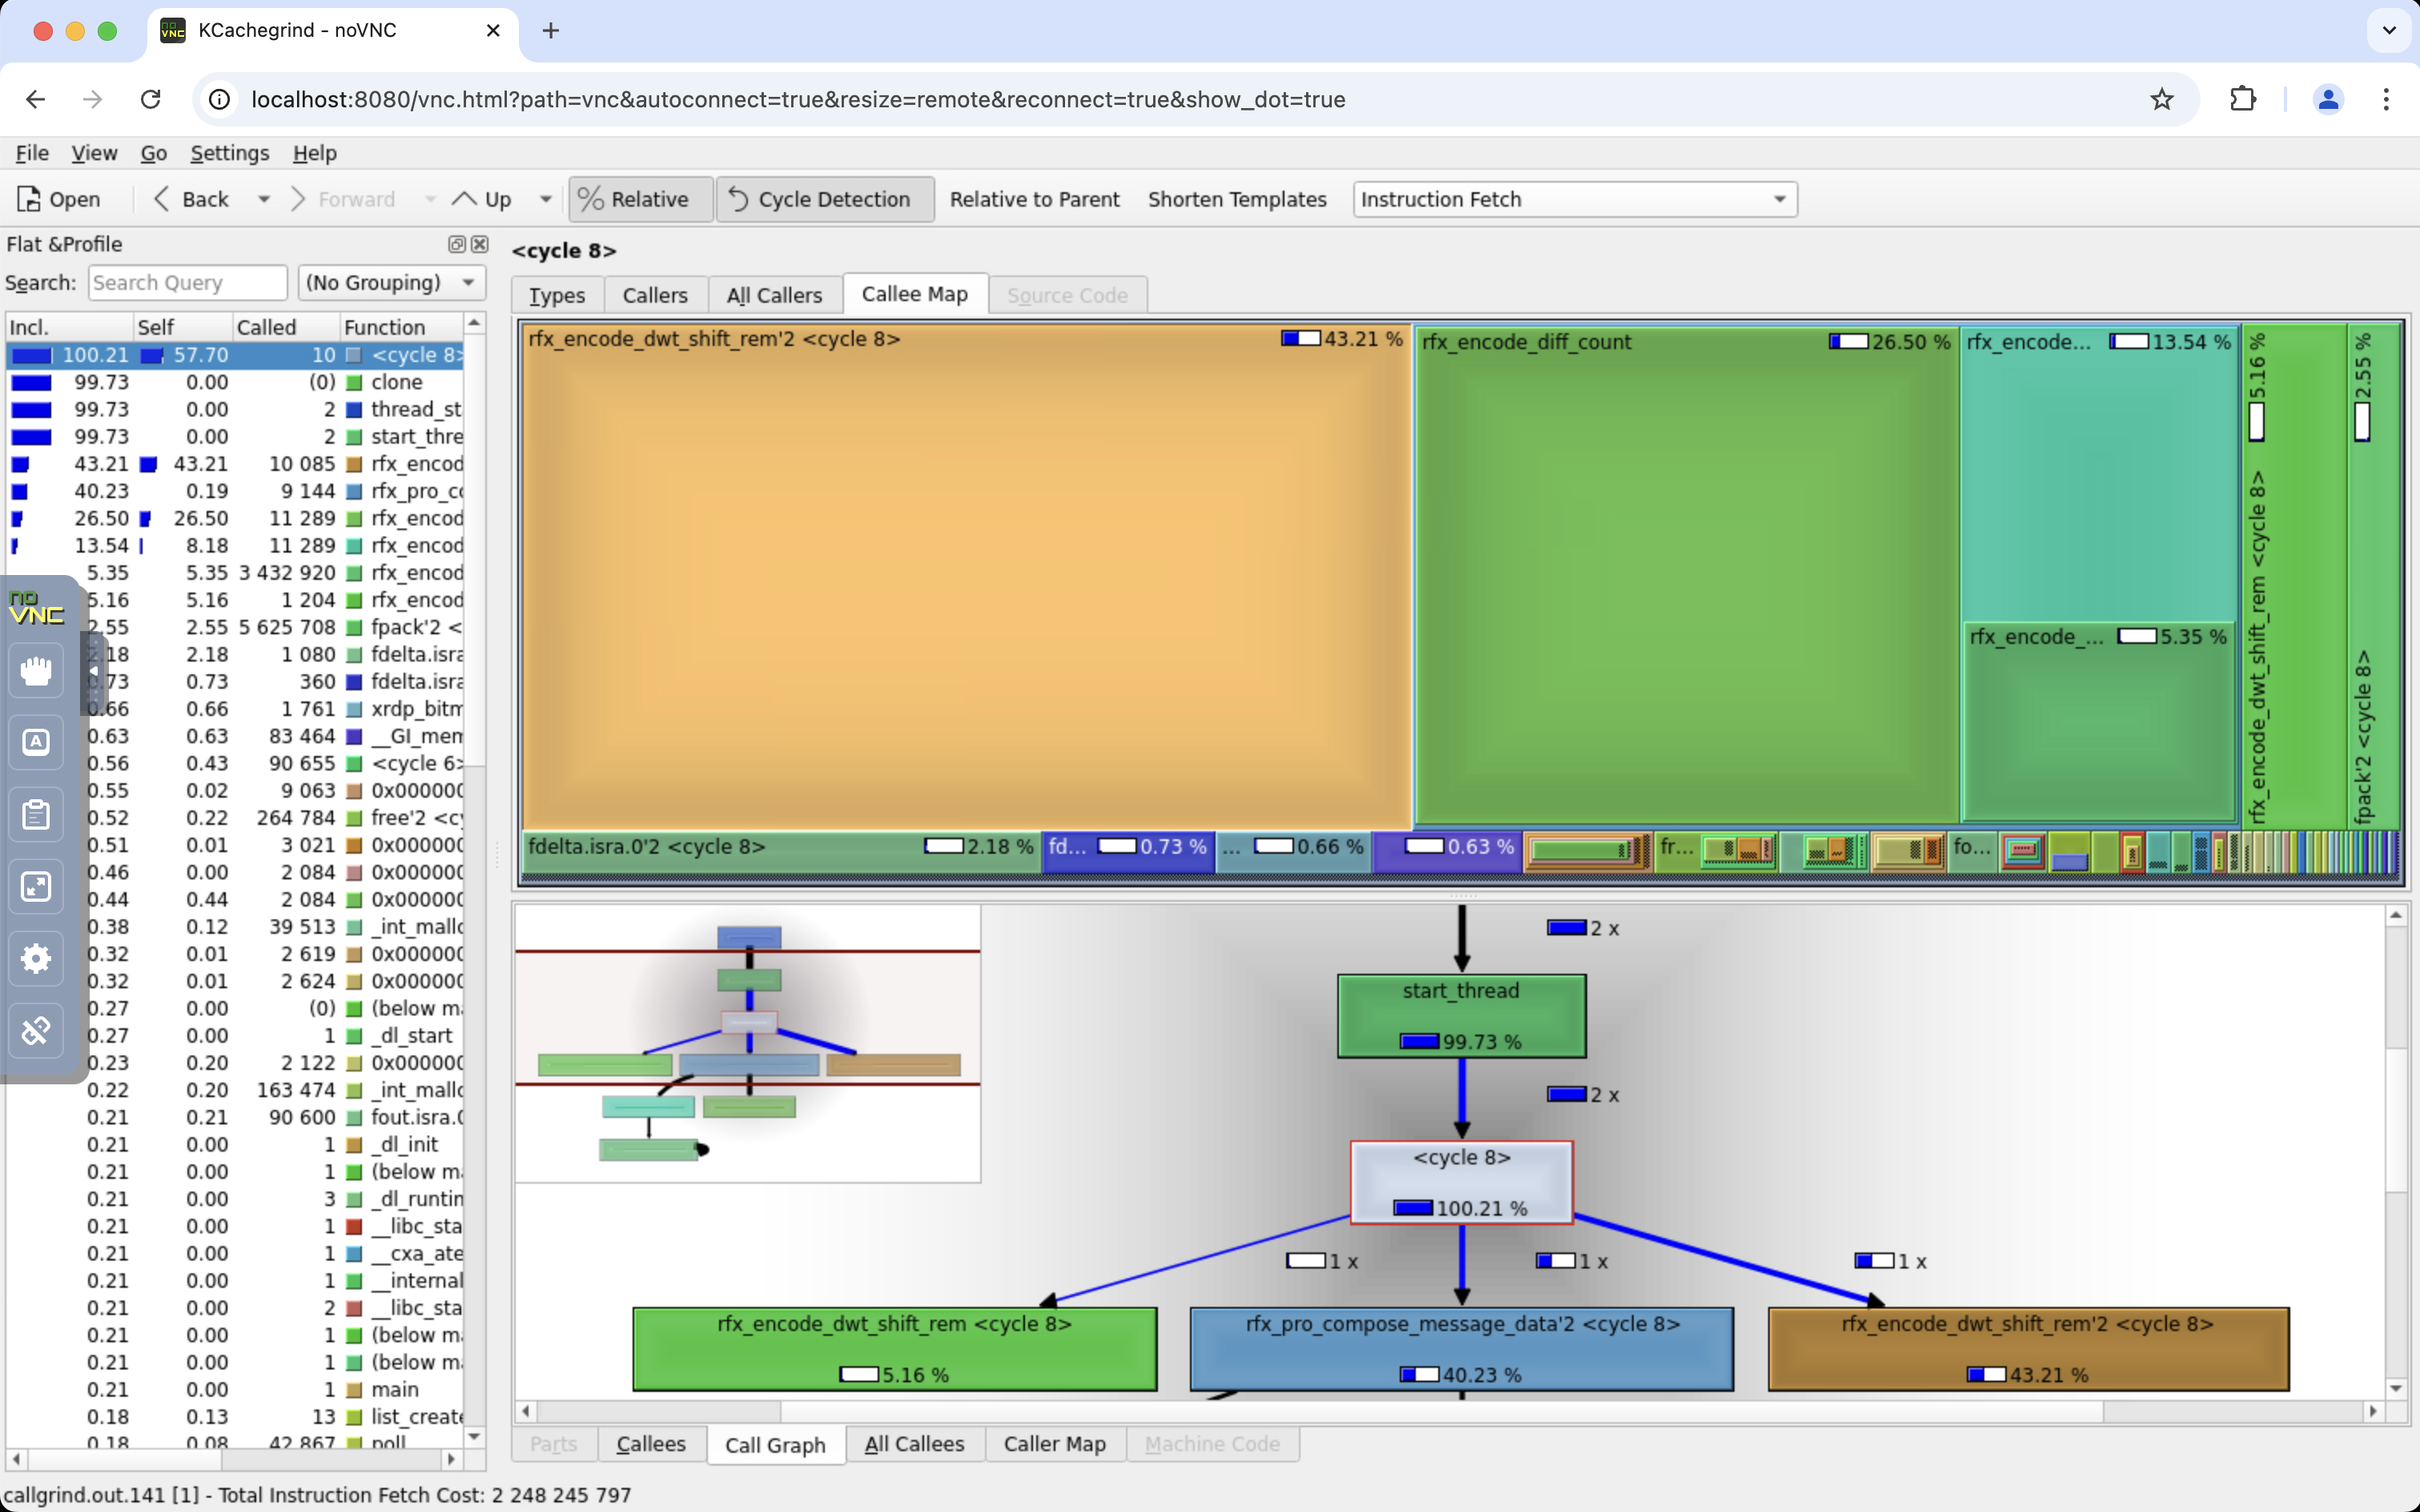
Gain performance insights of C and C++ applications using Valgrind with Callgrind as the profiling tool.
valgrind --tool=callgrind --dump-instr=yes --collect-jumps=yes <your program>docker run \
--name kcachegrind \
--pull always \
--restart unless-stopped \
-p 127.0.0.1:80:80 \
-v "${PWD}:/data" \
nedix/kcachegrind- Navigate your web browser to the KCachegrind web page on http://127.0.0.1:80
- Click on the Open button in the toolbar
- Navigate to the
/datadirectory in the sidebar - Open your profiling report
Gain performance insights of PHP applications using Xdebug as the profiling tool.
wget https://raw.githubusercontent.com/nedix/kcachegrind-container/main/stacks/php/compose-kcachegrind.ymldocker compose -f compose-kcachegrind.yml up -d- Navigate your web browser to any page on http://127.0.0.1:8081 to capture a profiling report
- Navigate your web browser to the KCachegrind web page on http://127.0.0.1:8082
- Click on the Open button in the toolbar
- Navigate to the
/datadirectory in the sidebar - Open your profiling report